UX/UI case study · Desktop dashboard · 2025
PaletteBox: your music, in colour
A listening and practice dashboard that shows music lovers their week at a glance.
Context
From an analytics screen to a dashboard built for one listener.
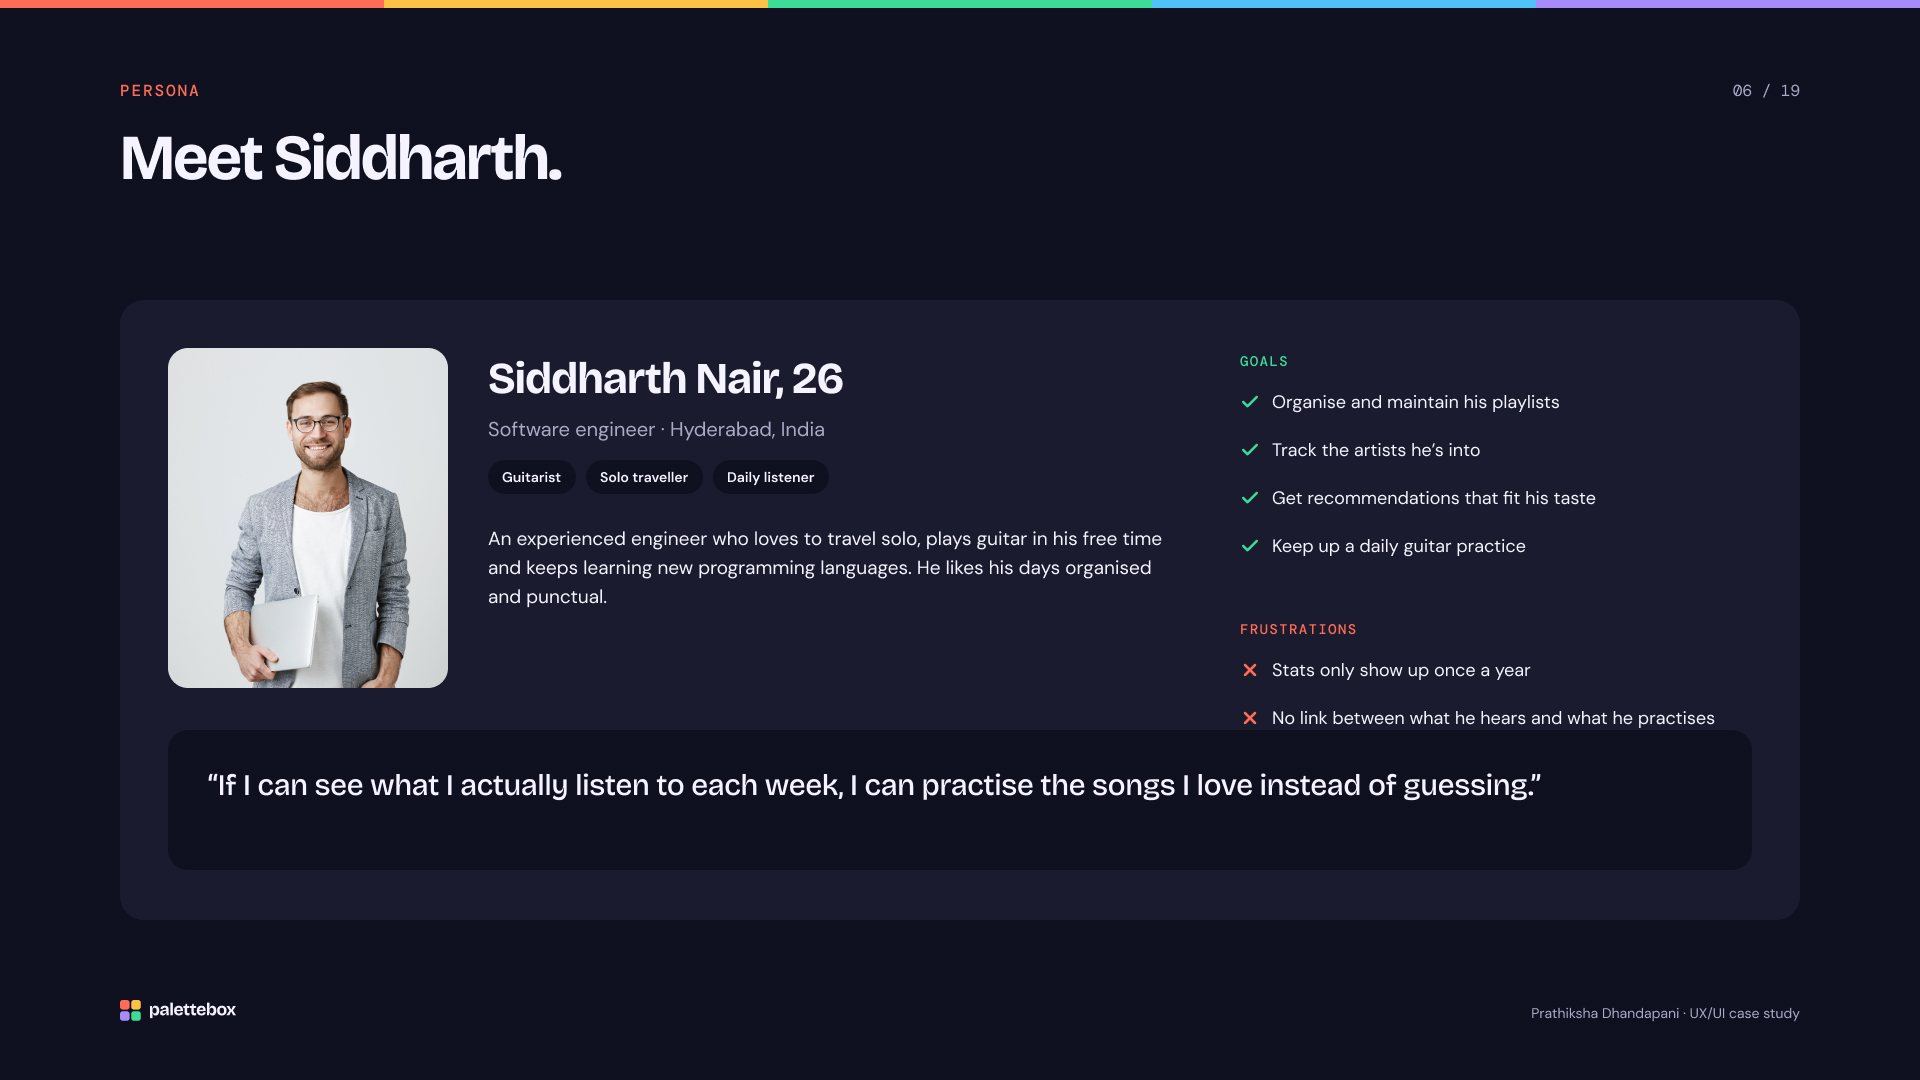
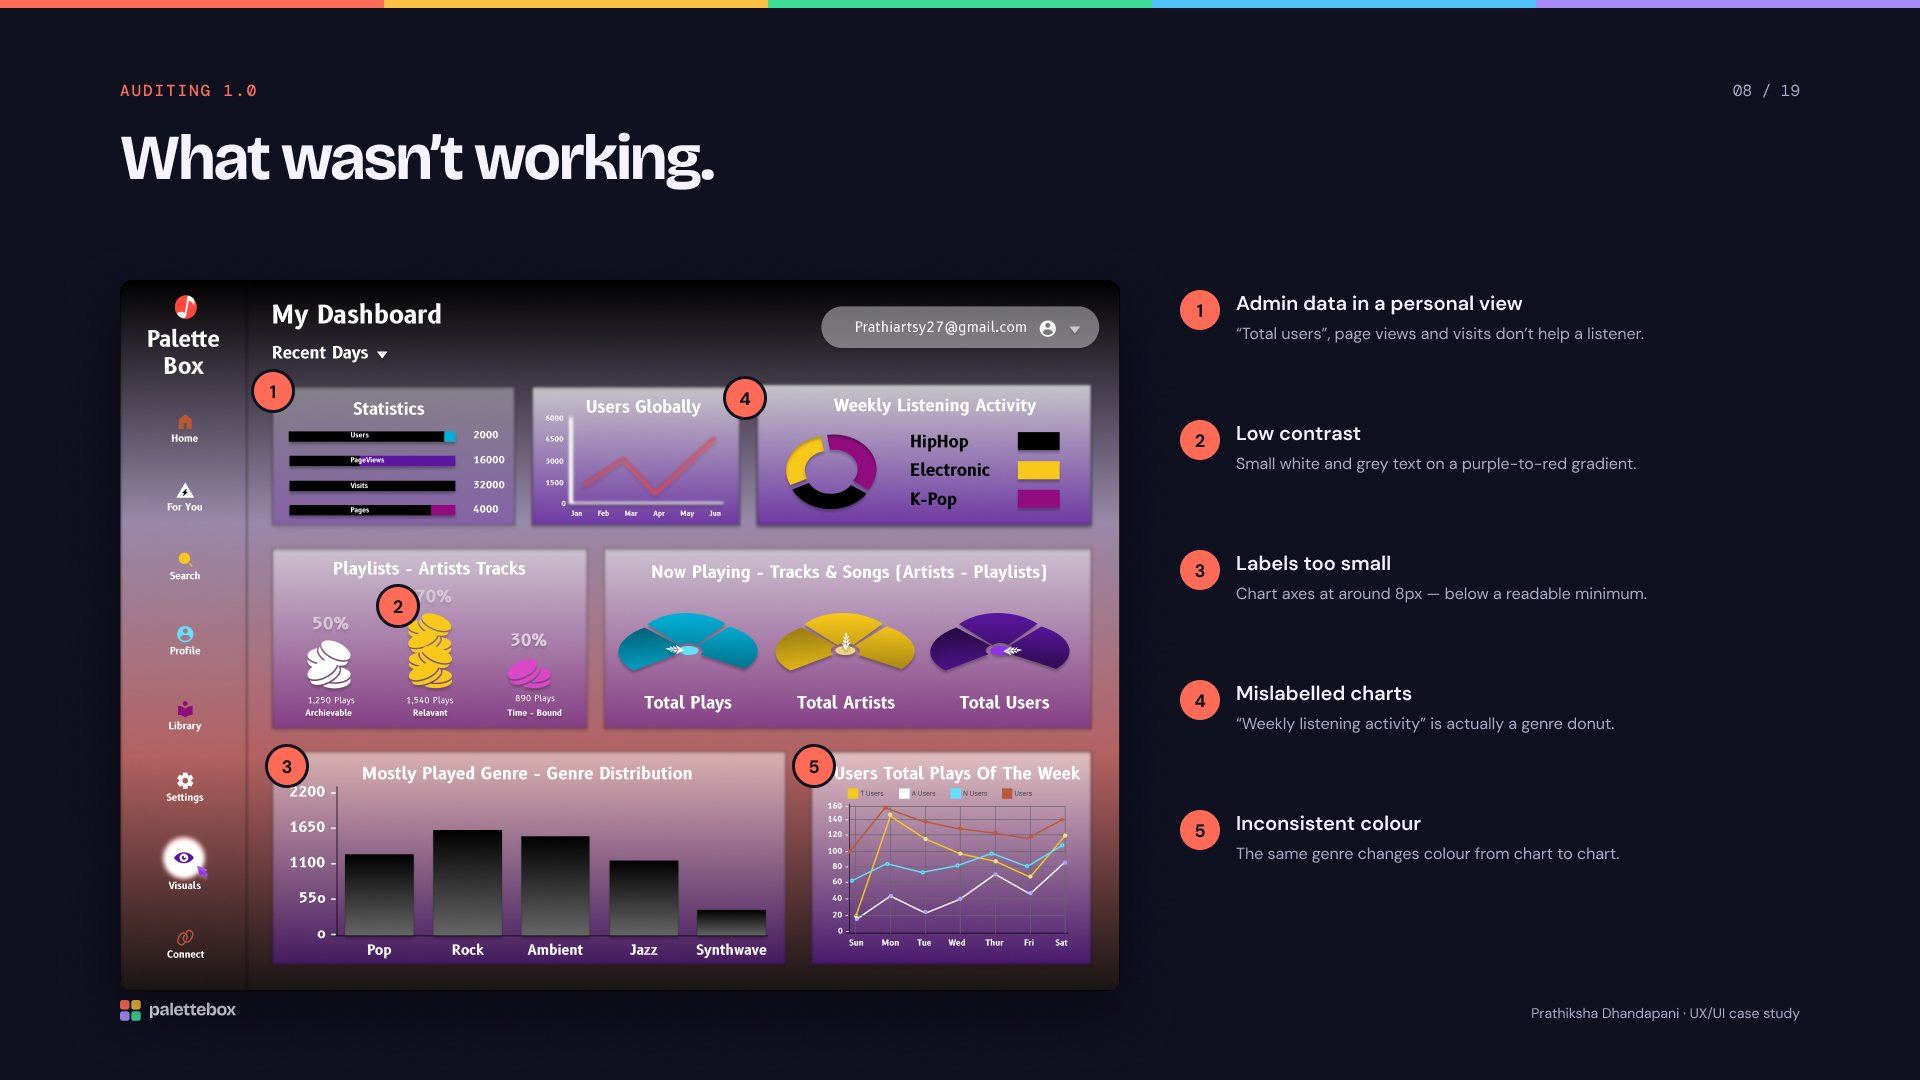
PaletteBox started as a music-and-instrument dashboard idea. Version 1.0 mixed a listener’s stats with admin numbers like total users and page views, used a busy gradient behind small text, and had no clear audience. Version 2.0 rebuilds it around one person: Siddharth, a software engineer who plays guitar.
The problem
Music lovers have the data — but no clear picture of their own habits.
Streaming apps track every play, but the stats are scattered across year-end recaps and settings screens. People who also play an instrument have nowhere to see listening and practice side by side.
Process
Fixing who it’s for.
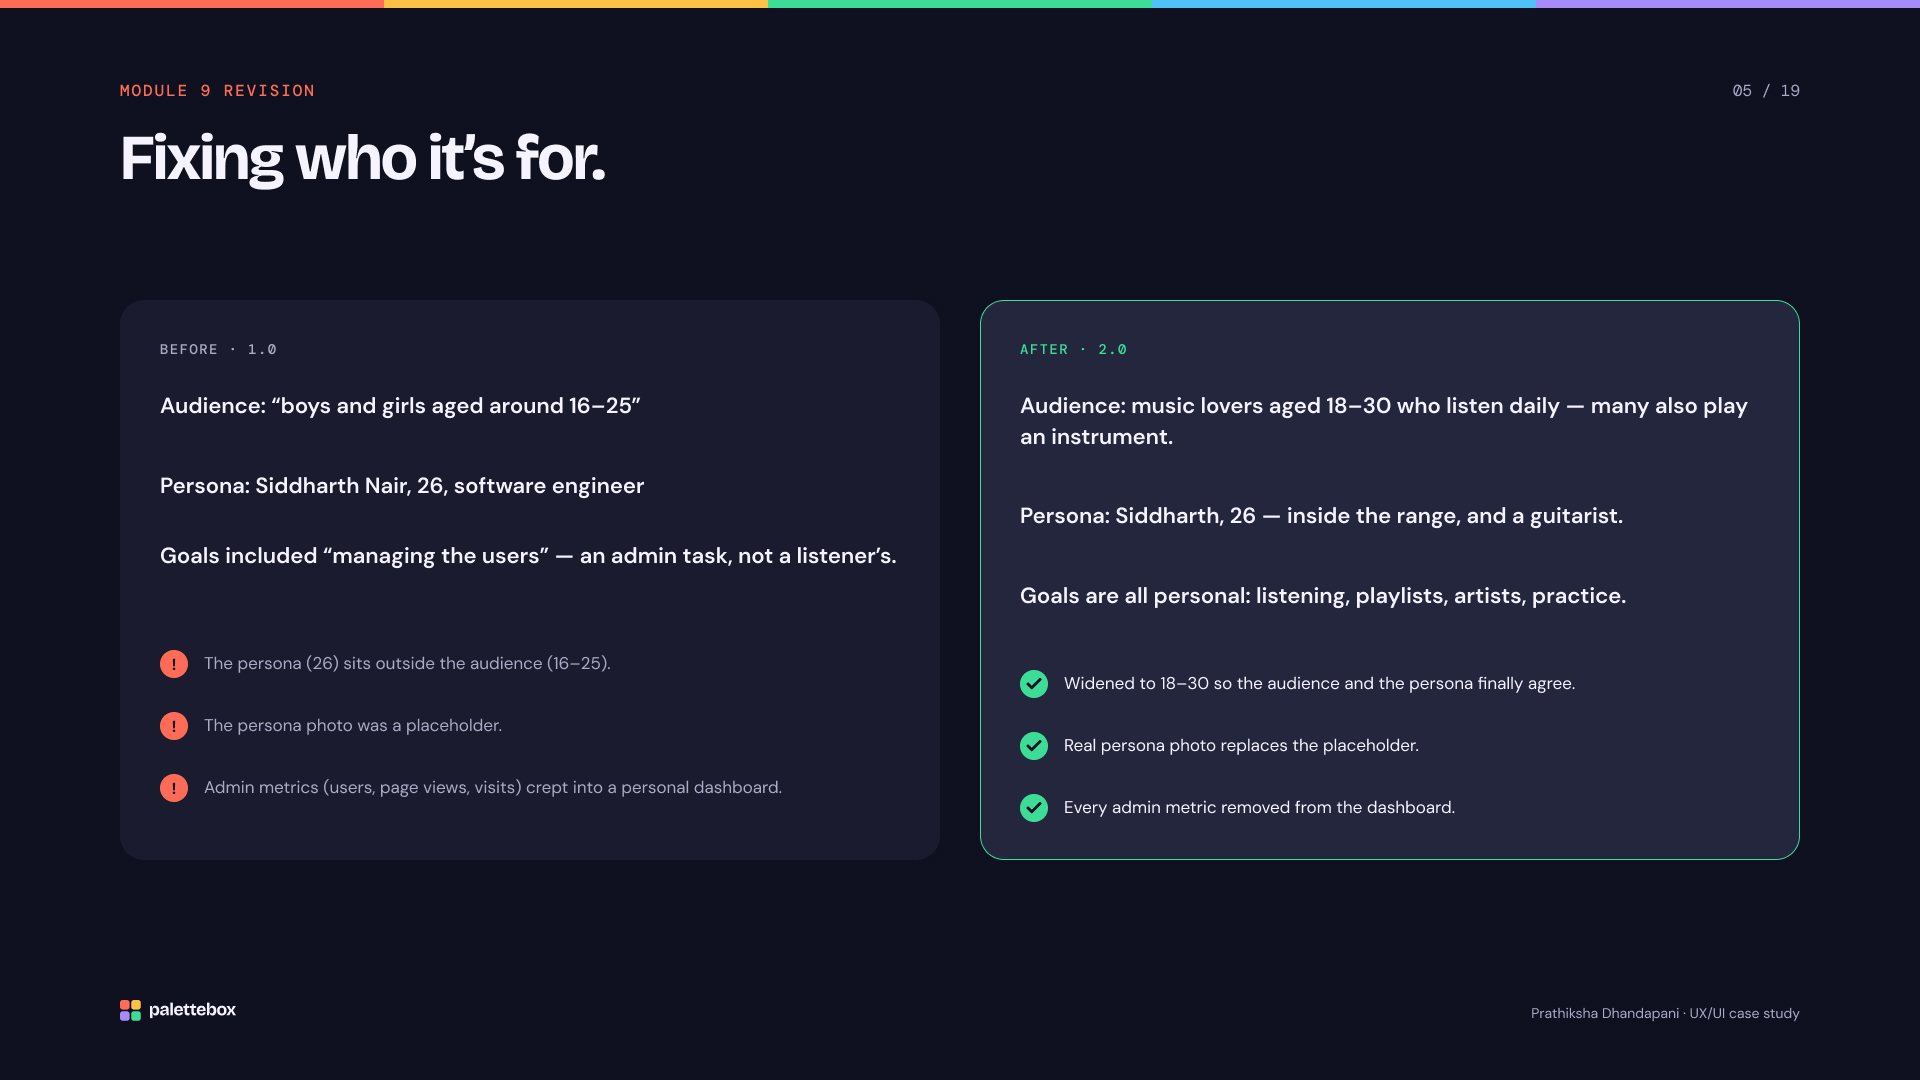
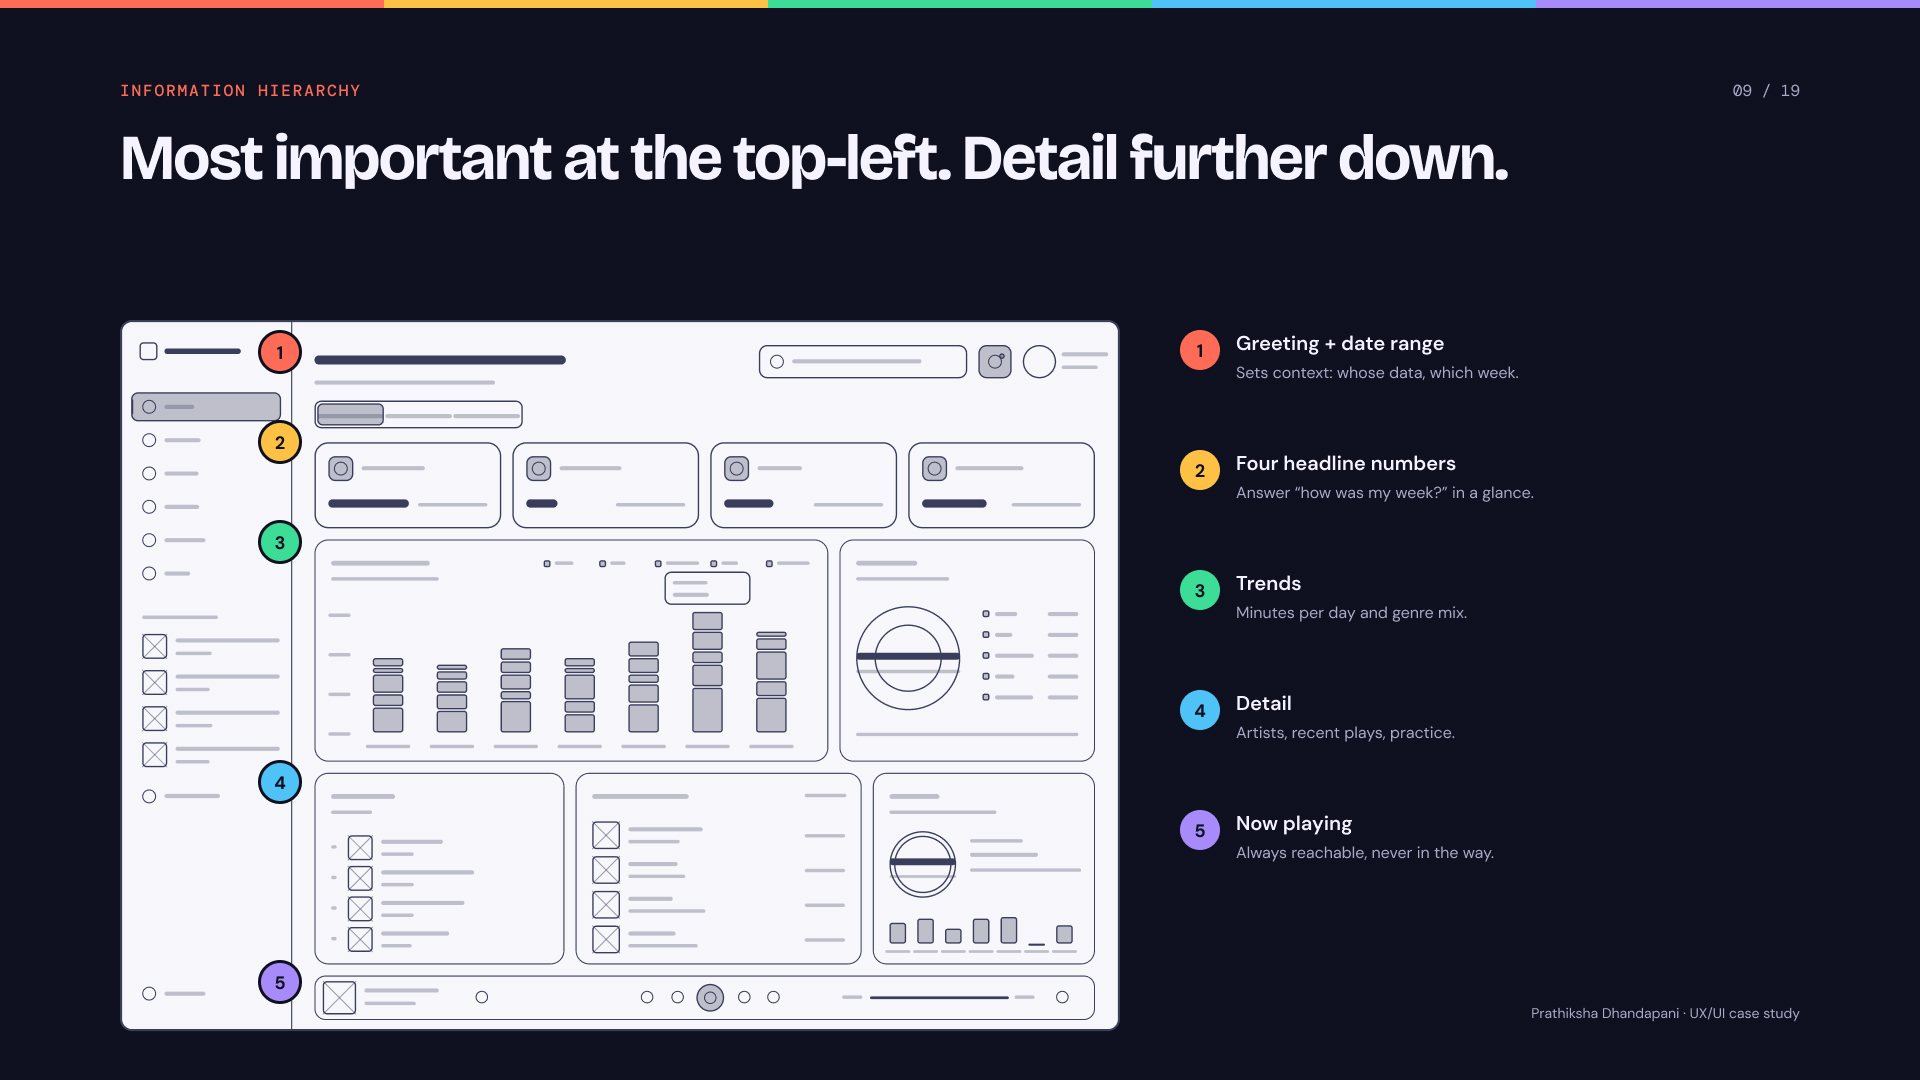
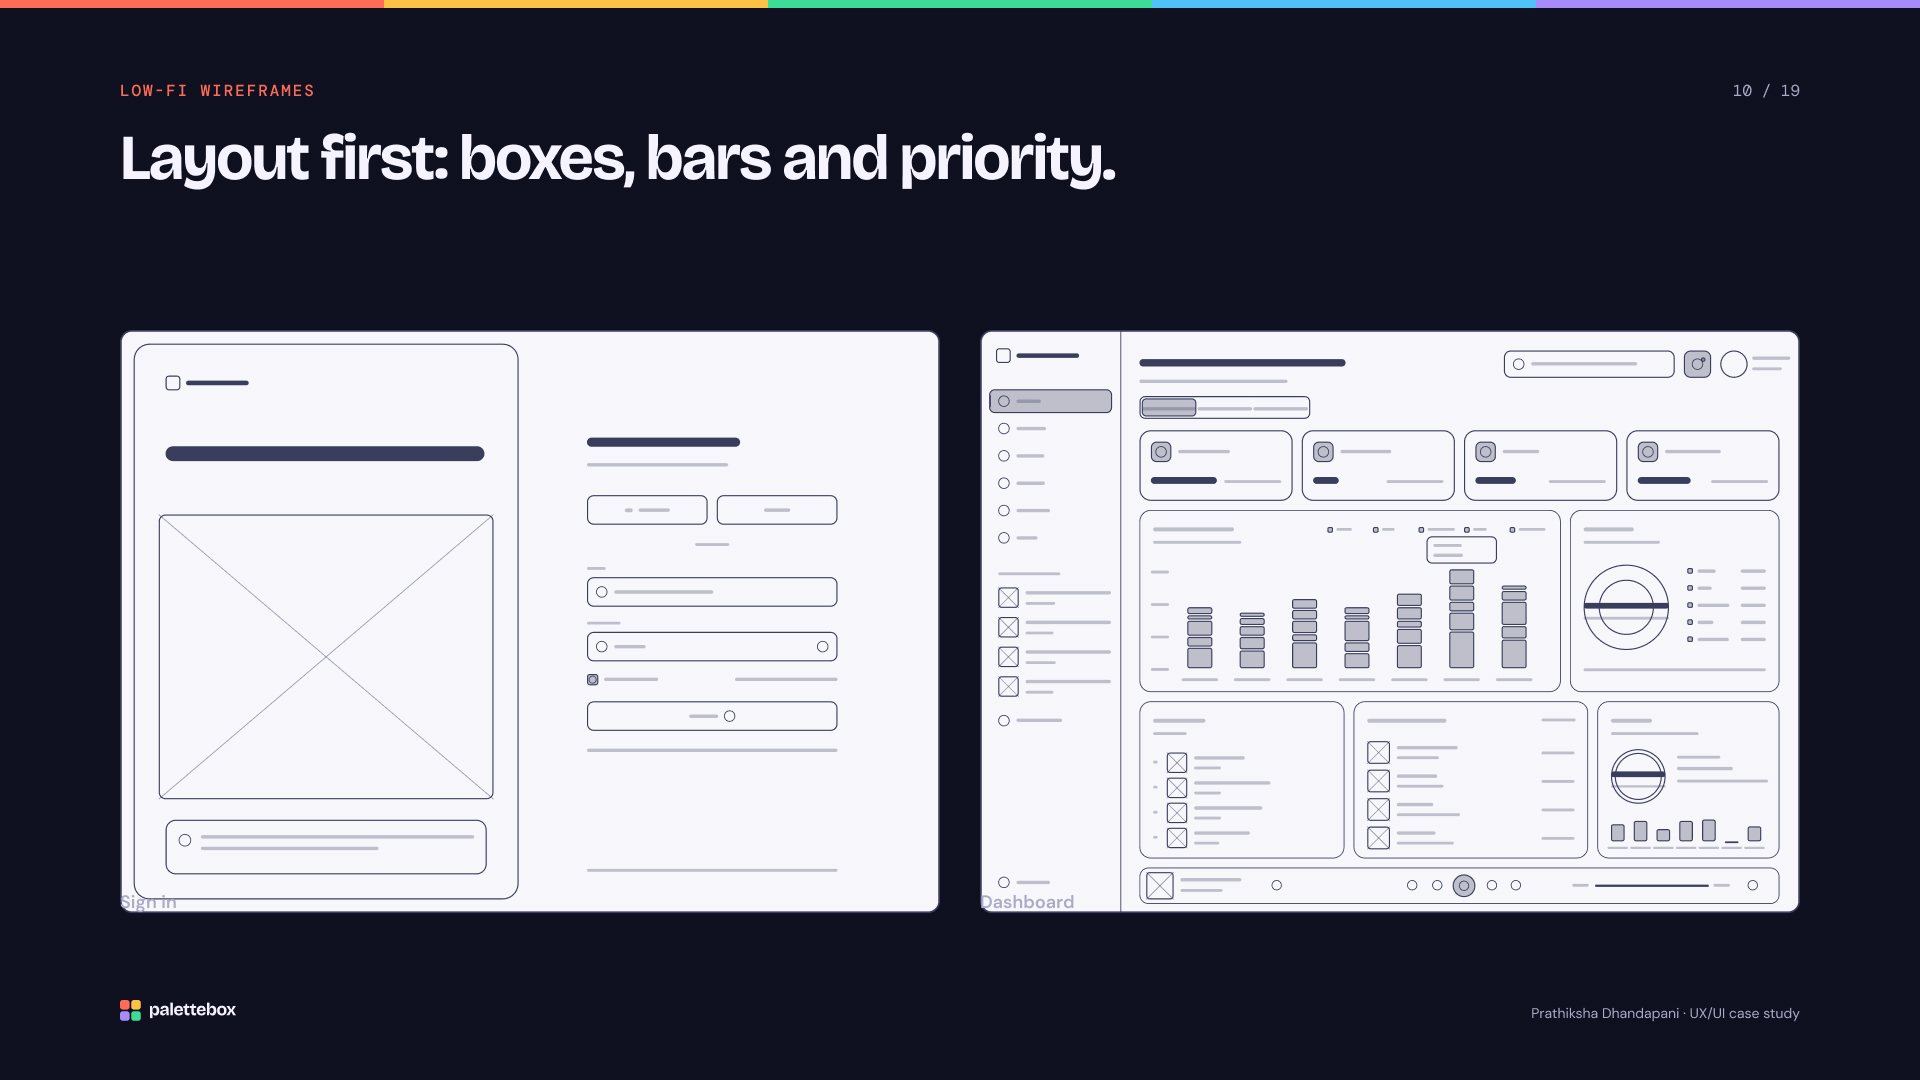
In 1.0 the persona (26) sat outside the audience (16–25), and admin metrics crept into a personal dashboard. I widened the audience to music lovers aged 18–30, removed every admin metric, and put the most important information at the top-left with detail further down.
Key decision · Before & after
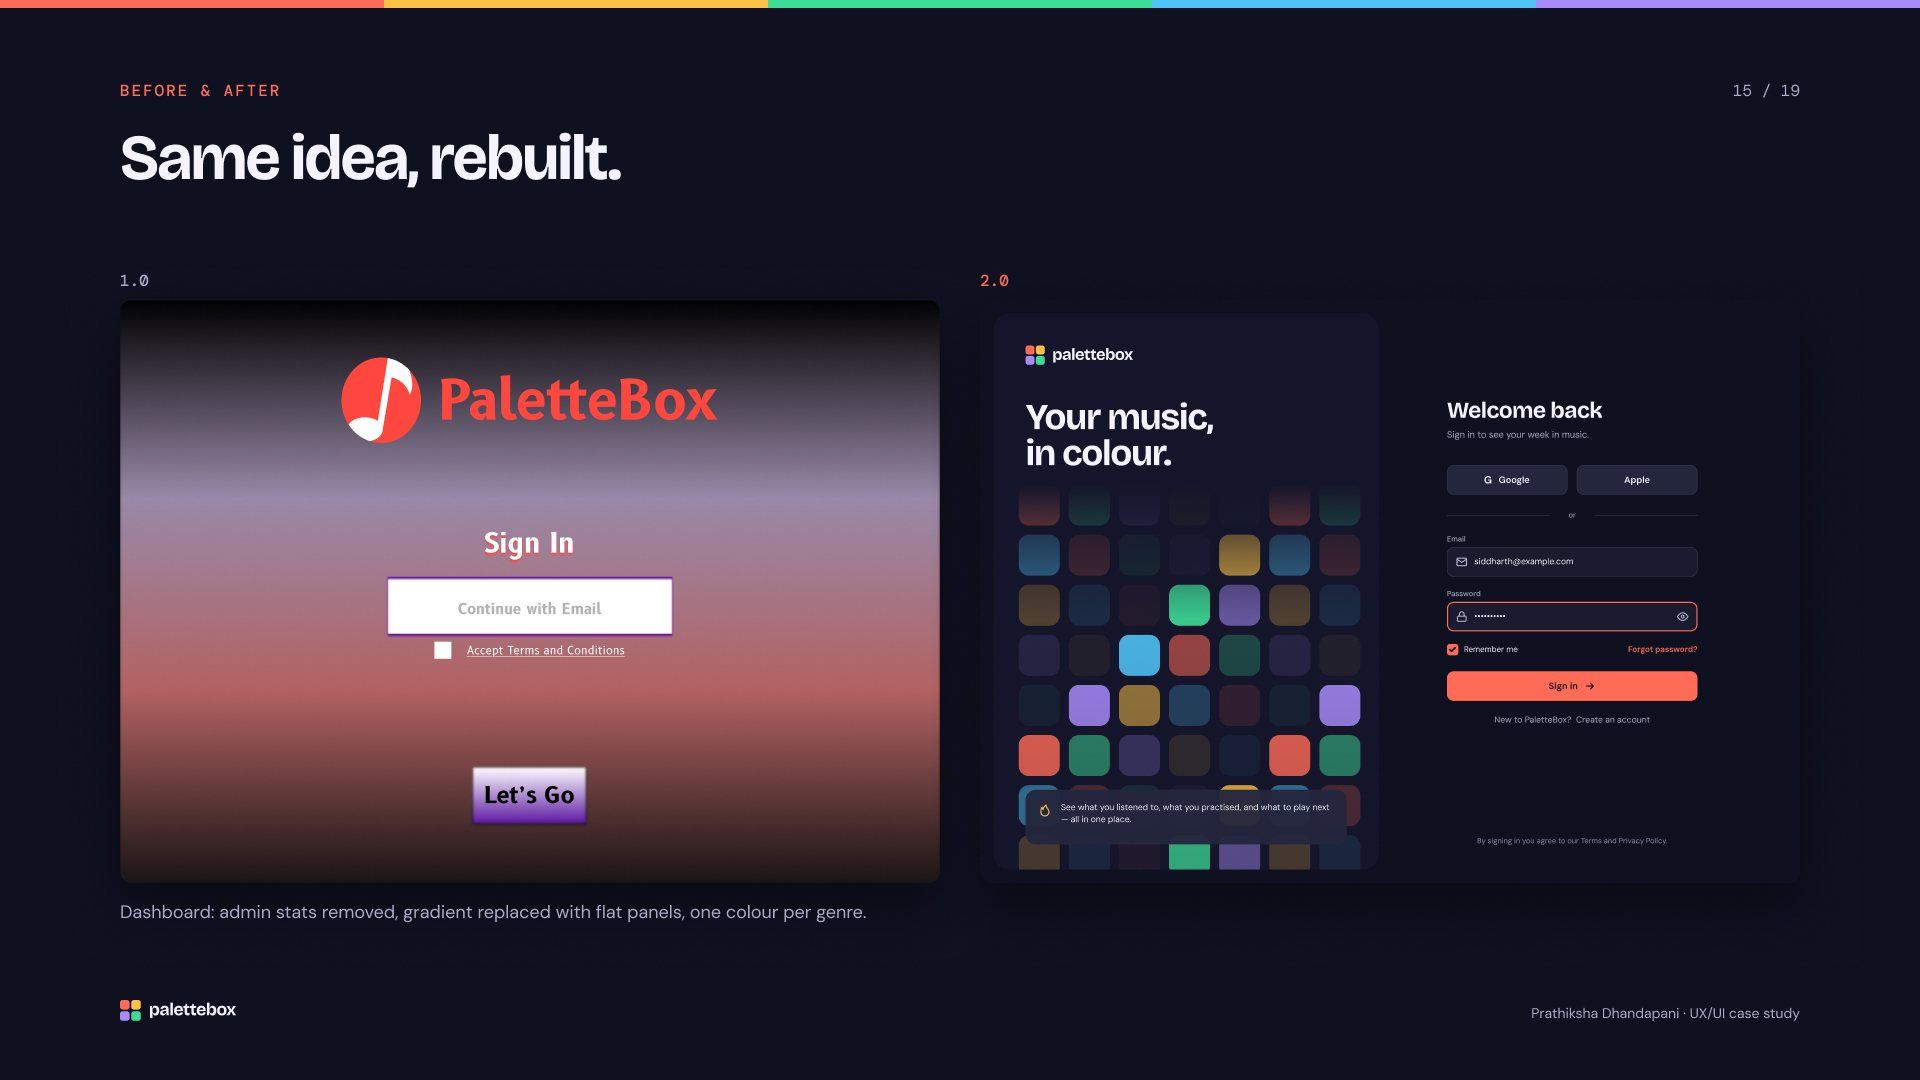
Same idea, rebuilt.
What changed
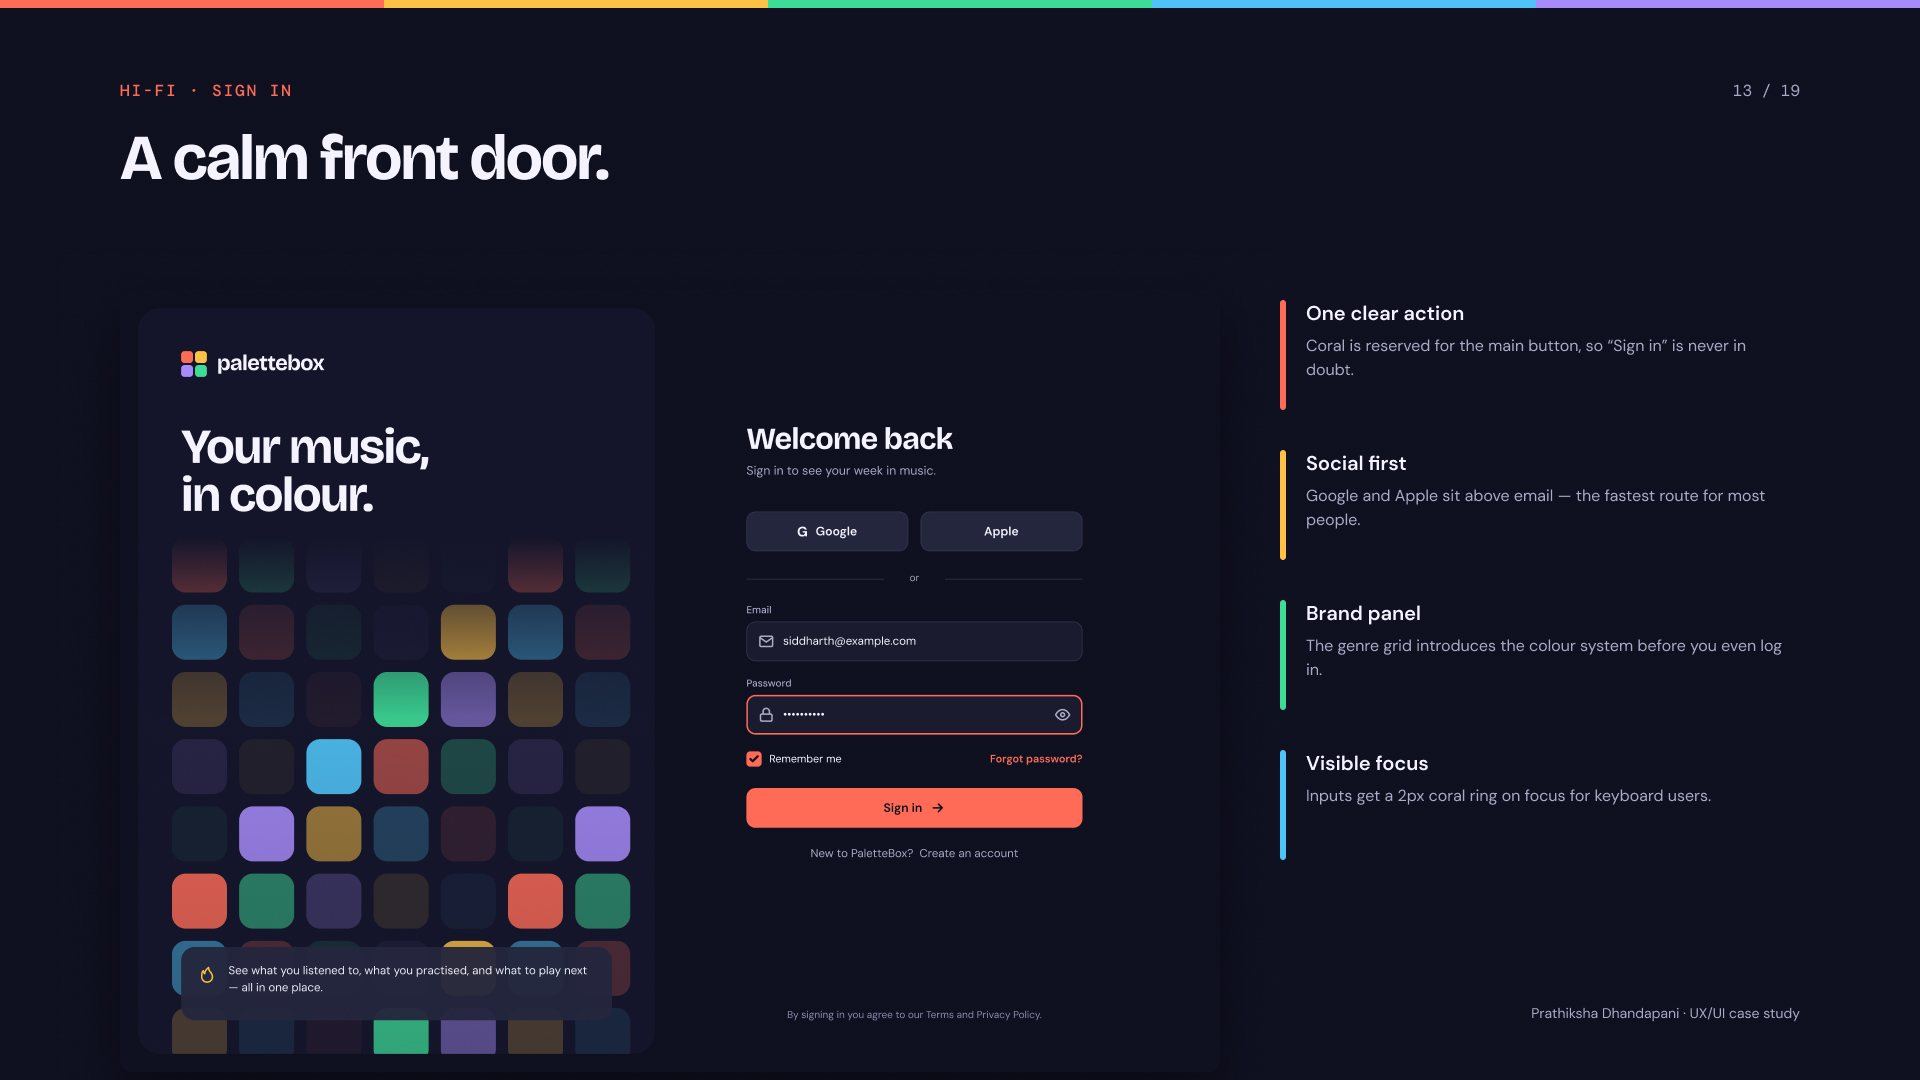
- Dashboard: admin stats removed, gradient replaced with flat panels, one colour per genre.
Final work
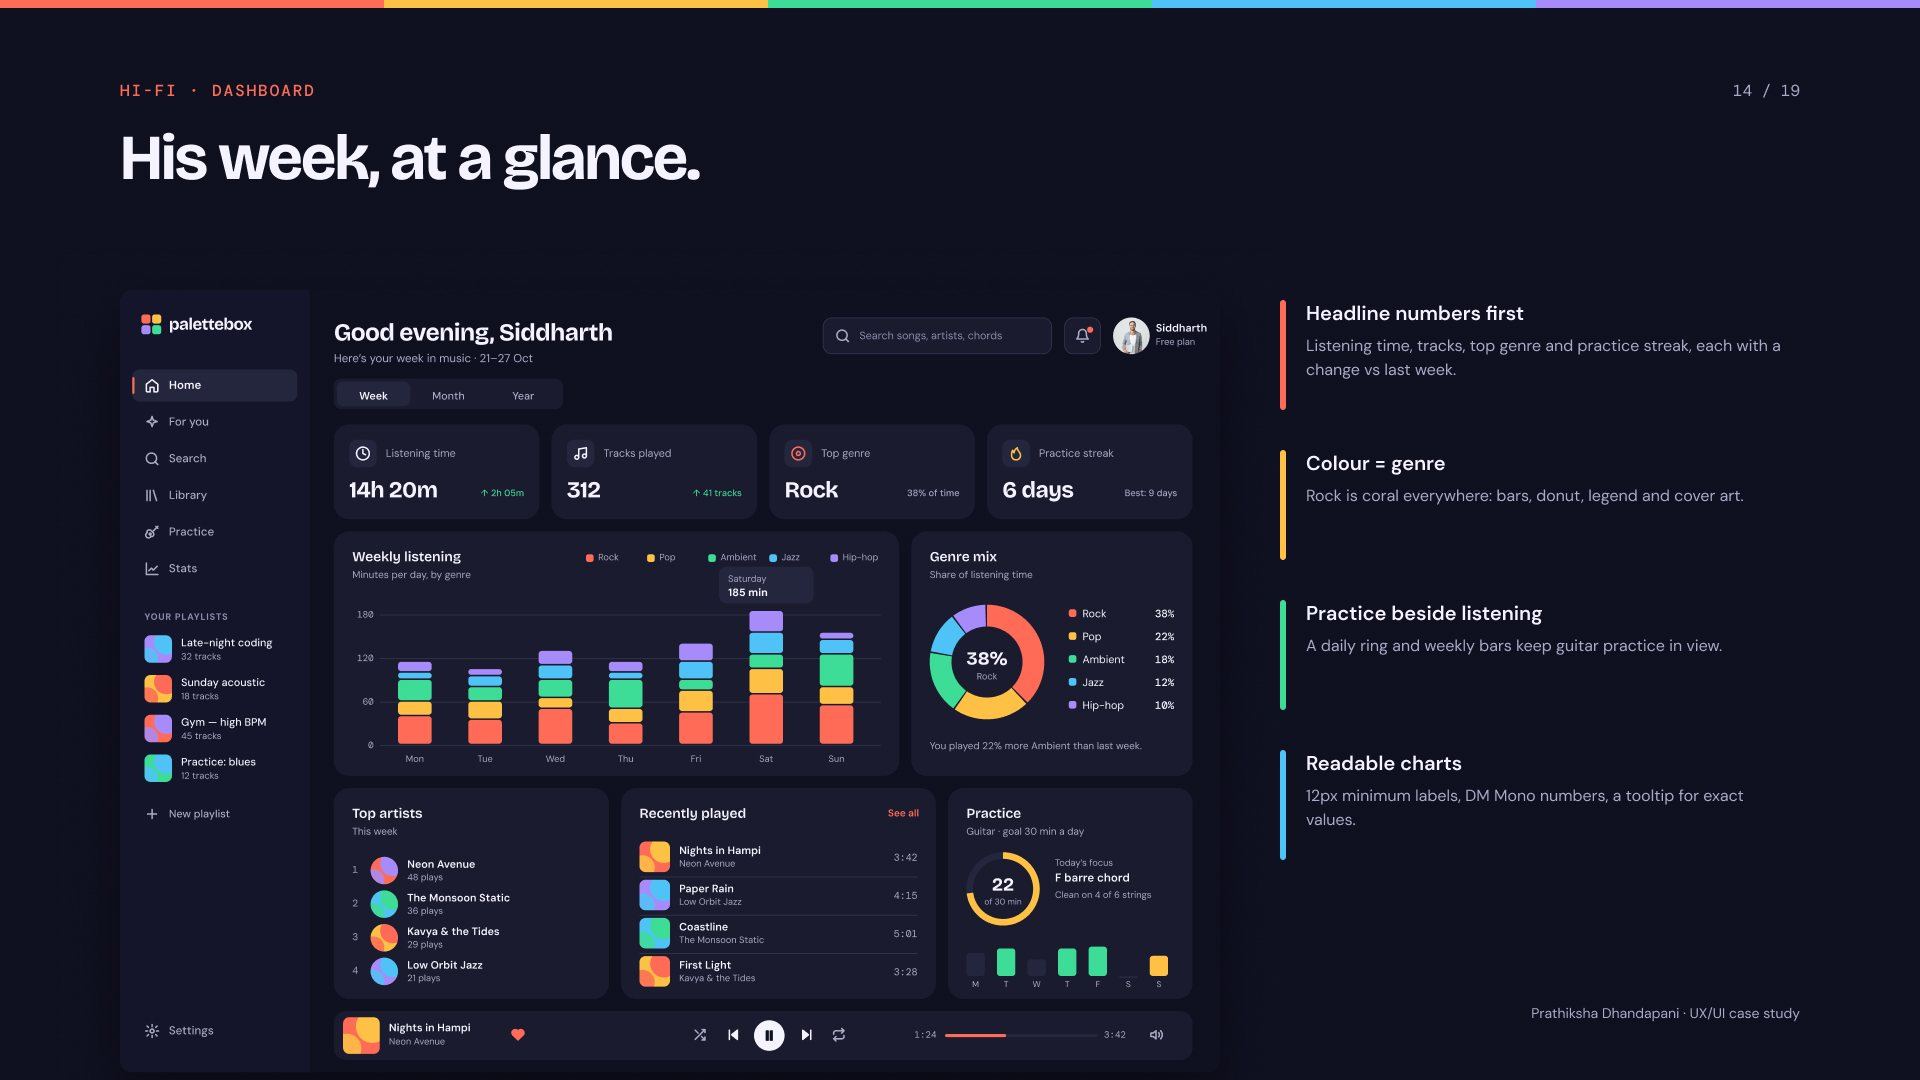
His week, at a glance.
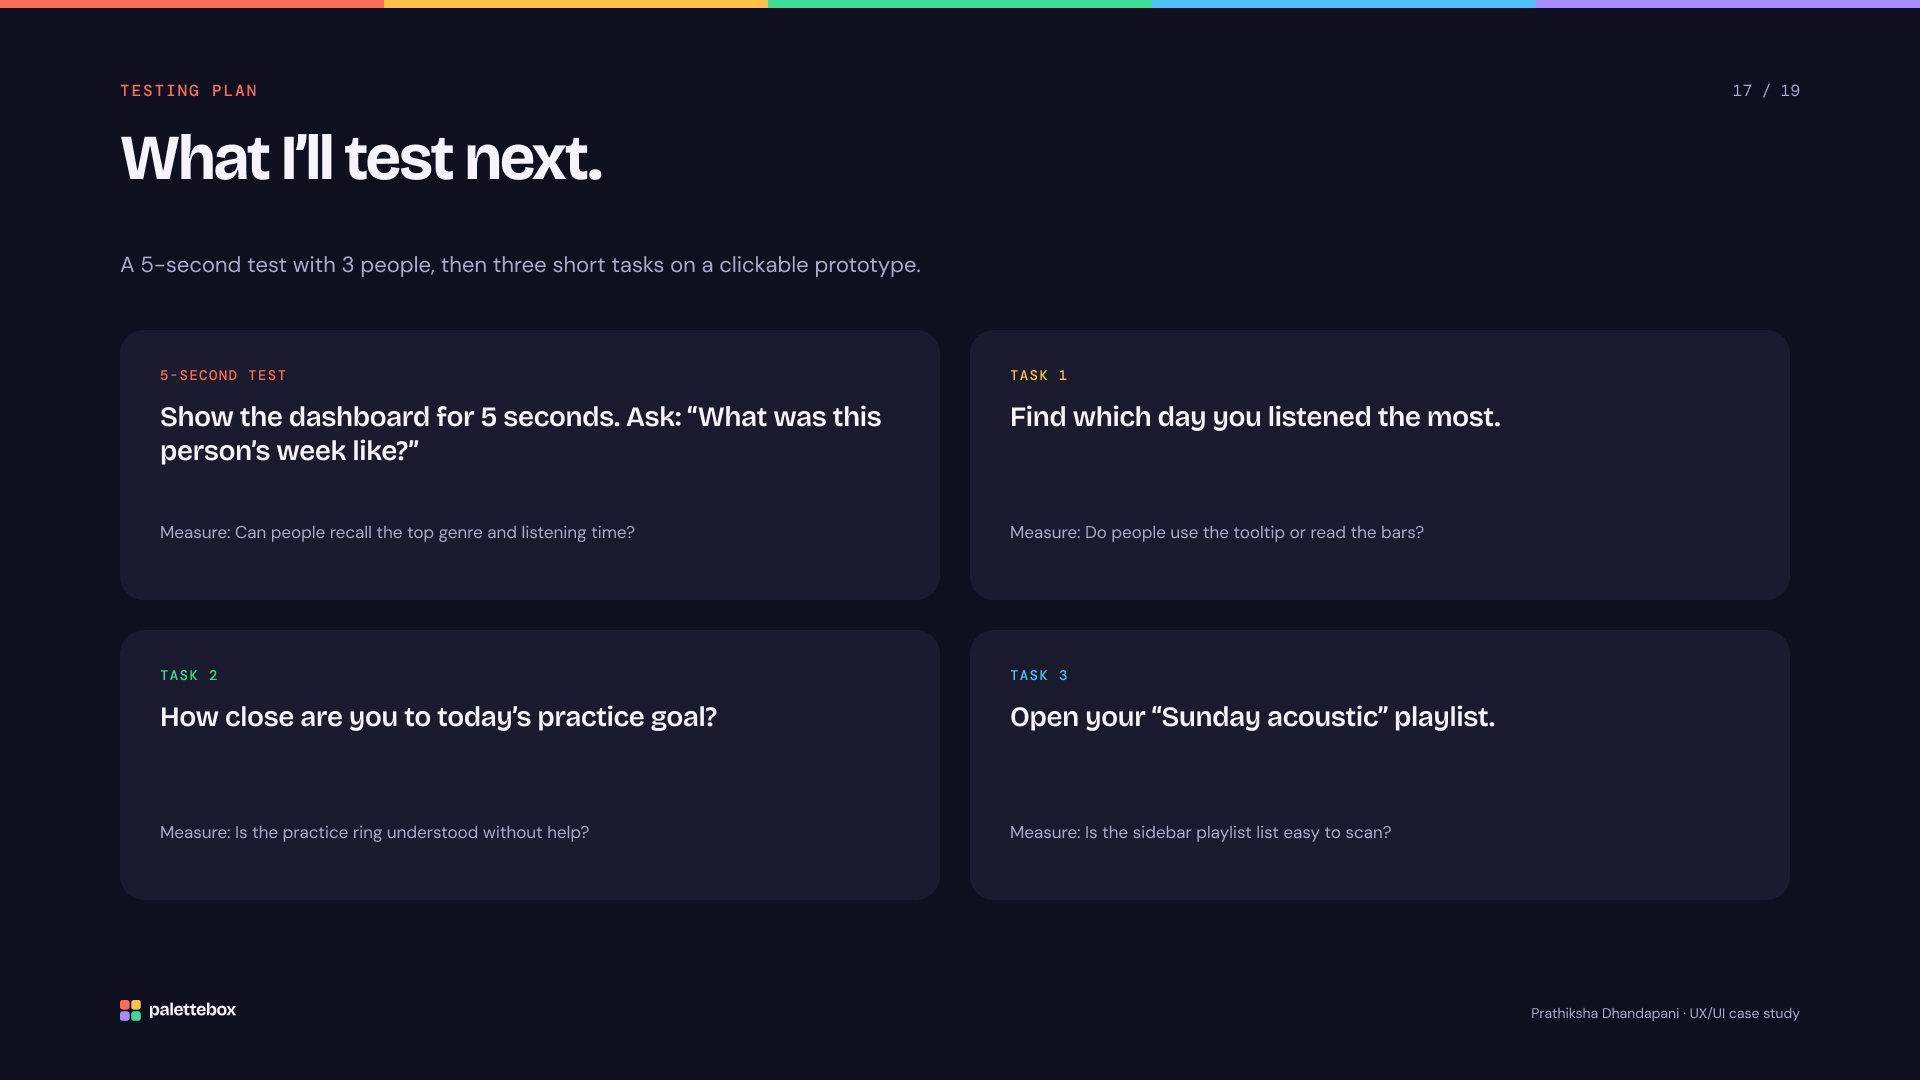
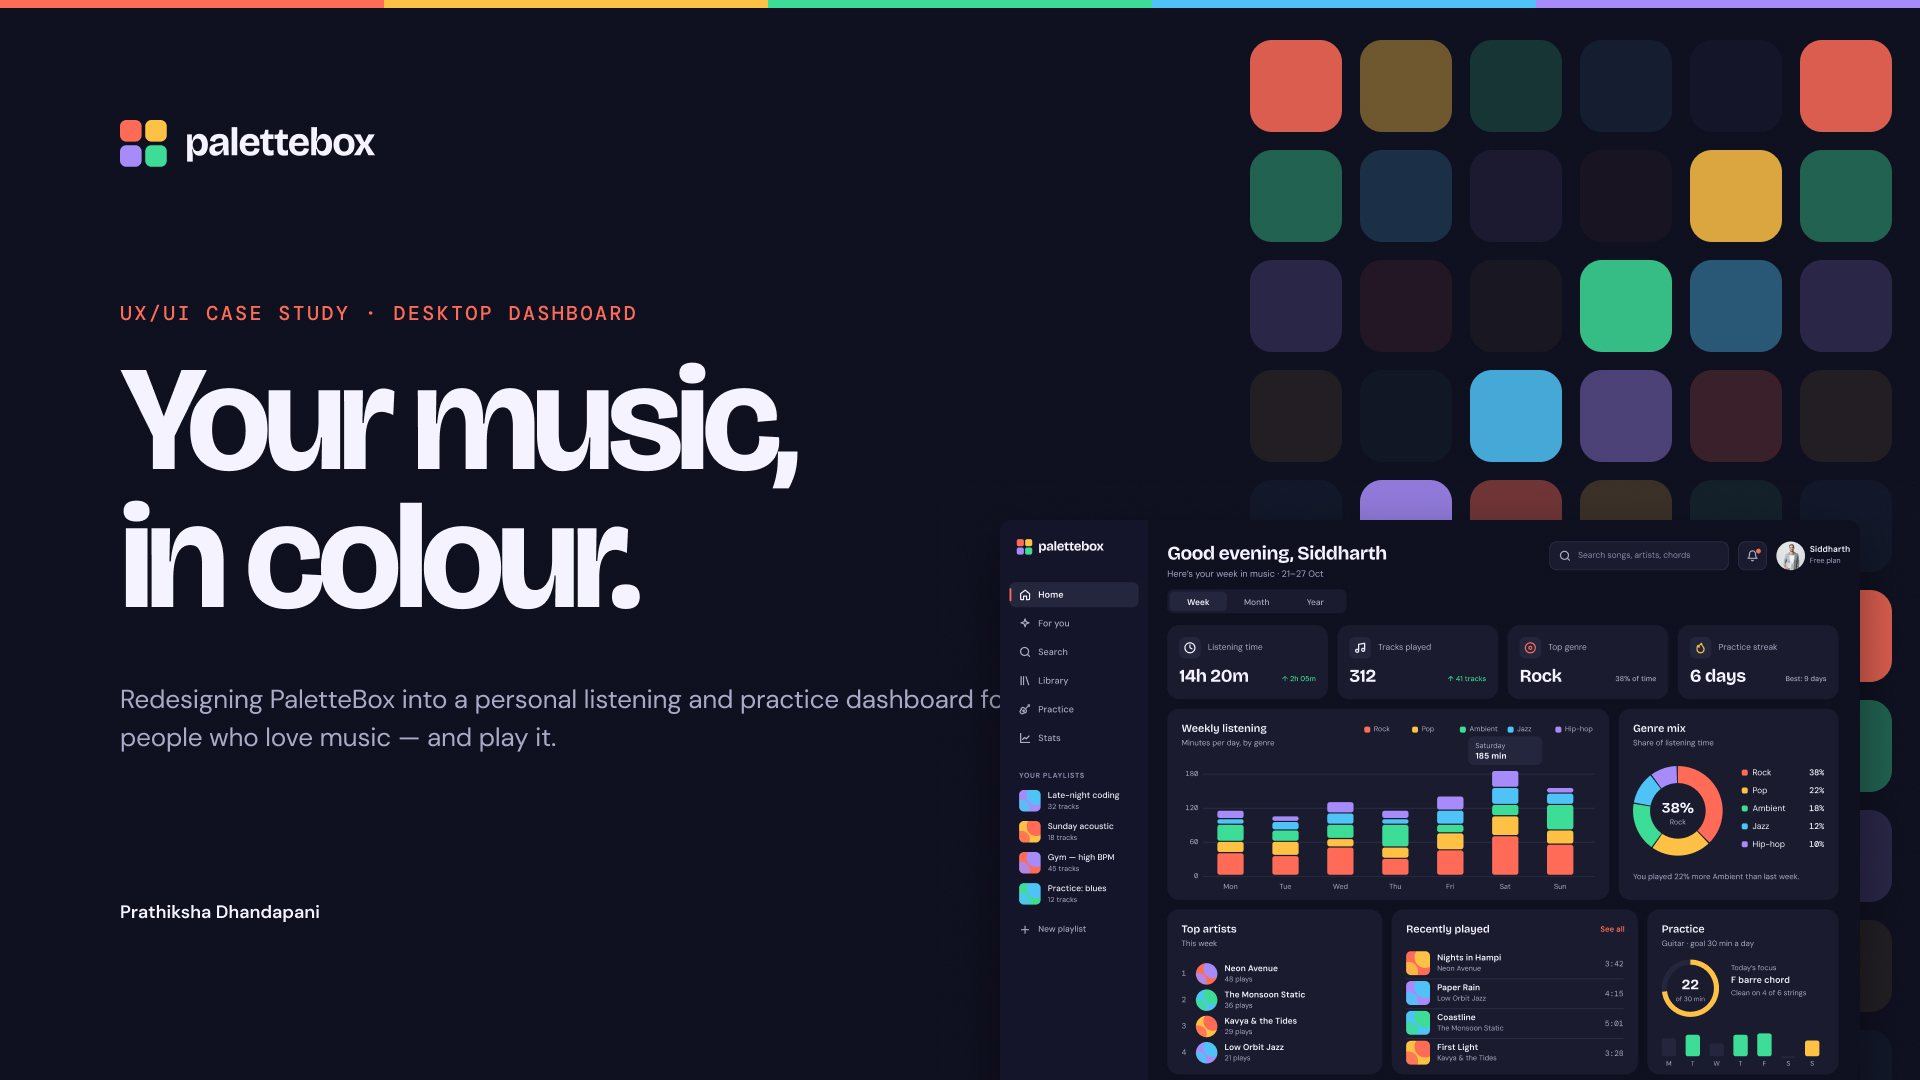
Listening time, tracks, top genre and practice streak, each with a change vs last week. Rock is coral everywhere: bars, donut, legend and cover art. A daily ring and weekly bars keep guitar practice in view, with 12px minimum labels and a tooltip for exact values.
Reflection
What this redesign taught me.
Audience first
Most of 1.0’s problems traced back to an audience that didn’t match the persona. Fixing that fixed the content.
One colour per genre
Locking one colour to each genre turned five charts into one story.
Dark UI needs care
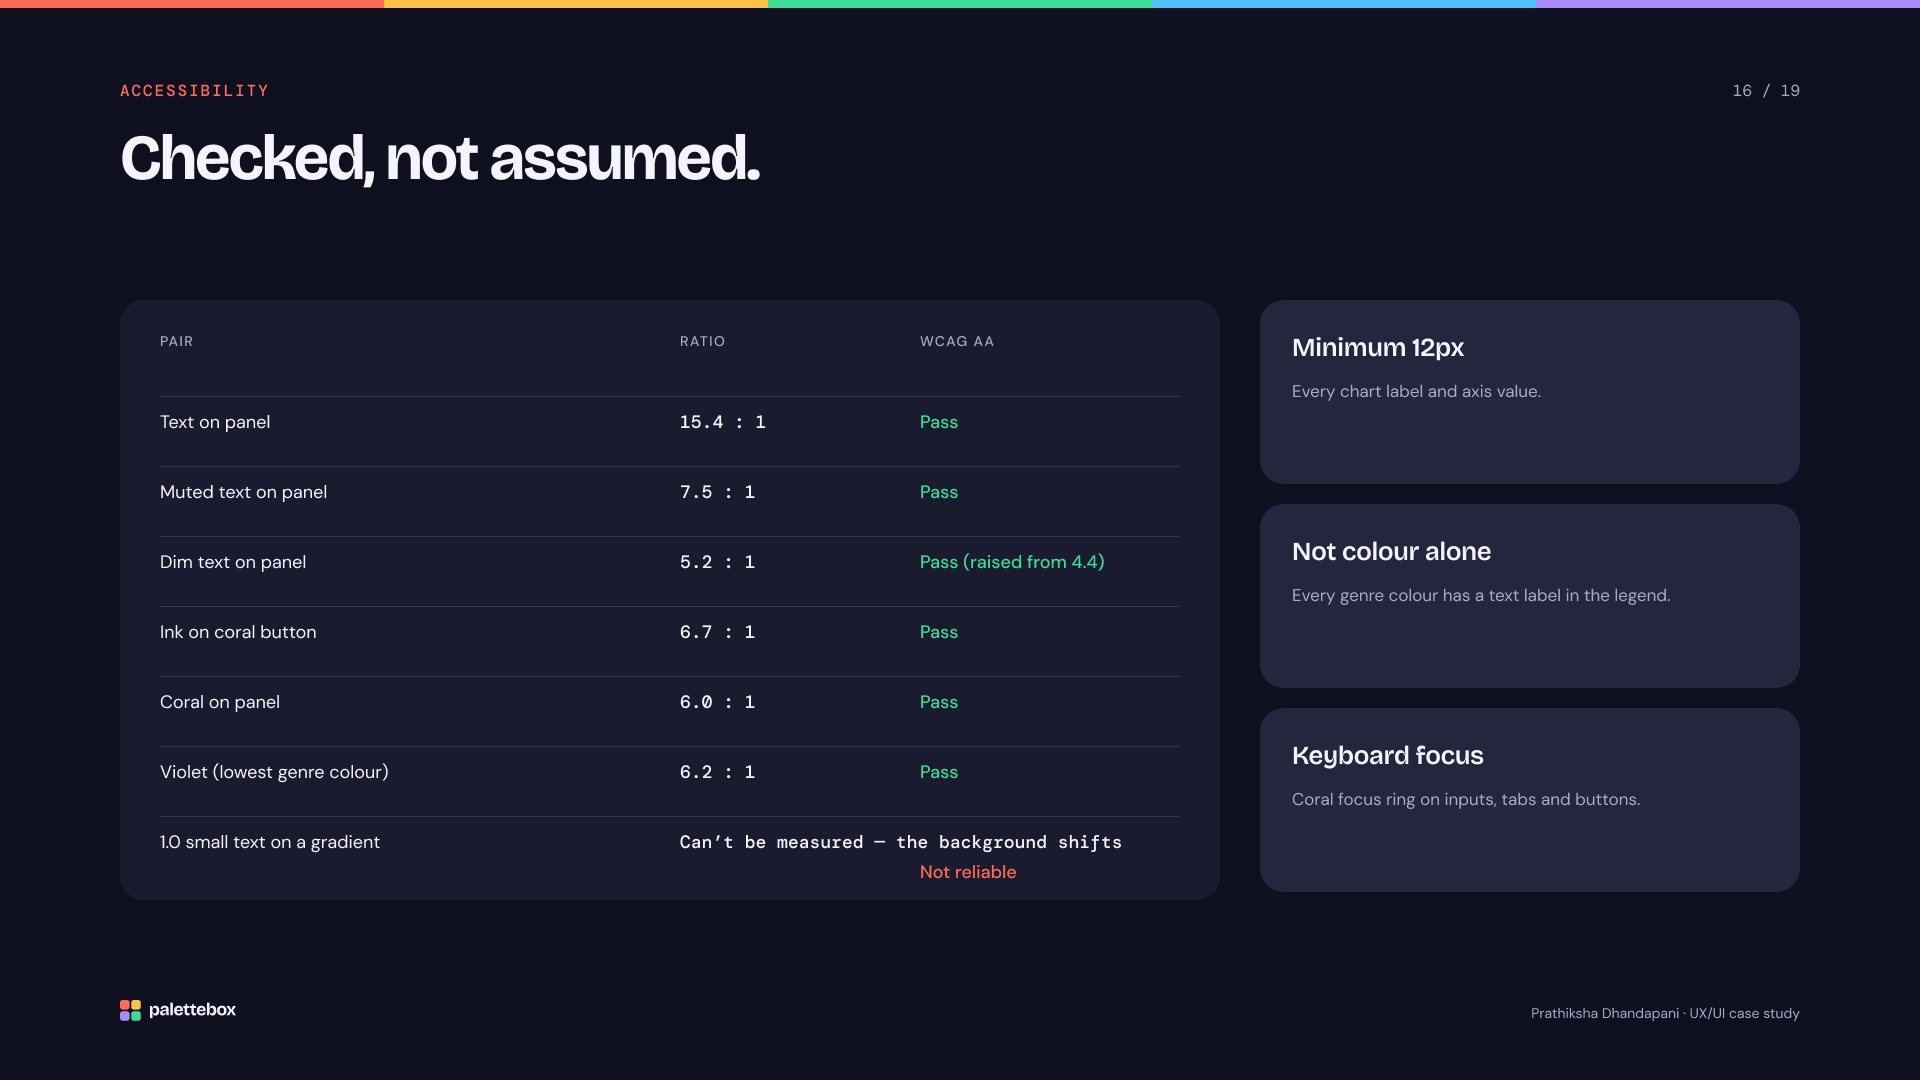
A dark UI only works with flat surfaces, real contrast checks and generous label sizes.